codepythonmit
gasweek
the base fee of every block of the last week, binned by hour of day and weekday, as a table and an svg, so you can see when ethereum is cheapest. it writes the daily dataset.
head a023e4d2026-09-1530 files576 lines of python
record
- commits
- 23 on main, 2026-09-08 to 2026-09-15
- signed
- 14 good signature from 17BA…F3AB
9 from the daily data workflow no signature - tests
- 22 passed 1 skipped
python 3.11.9 on my machine, 2026-09-23 - ci
- ci.yml lists python 3.10, 3.12, 3.13, 3.14.
- history
- every commit up to a023e4d, each with its signed record. the history itself stays off this site, so from here you cannot tie a file to a commit.
- source
- gasweek.tar.gz, 27.8 KB · sha256
34e8b0e4a985…: the files at a023e4d, without README.md, which is shown below. - license
- mit (LICENSE)
readme
rendered from README.md at a023e4d. i left out the badges, which load from github and shields.io, and one link, which shows as plain text. the install lines point at github, which answers 404 for this account at the moment.
gasweek
when is ethereum cheapest? the base fee of every block in the last week, binned by hour
of day and by weekday, as a table and as an svg. from eth_feeHistory on a public rpc,
no keys, nothing to install.
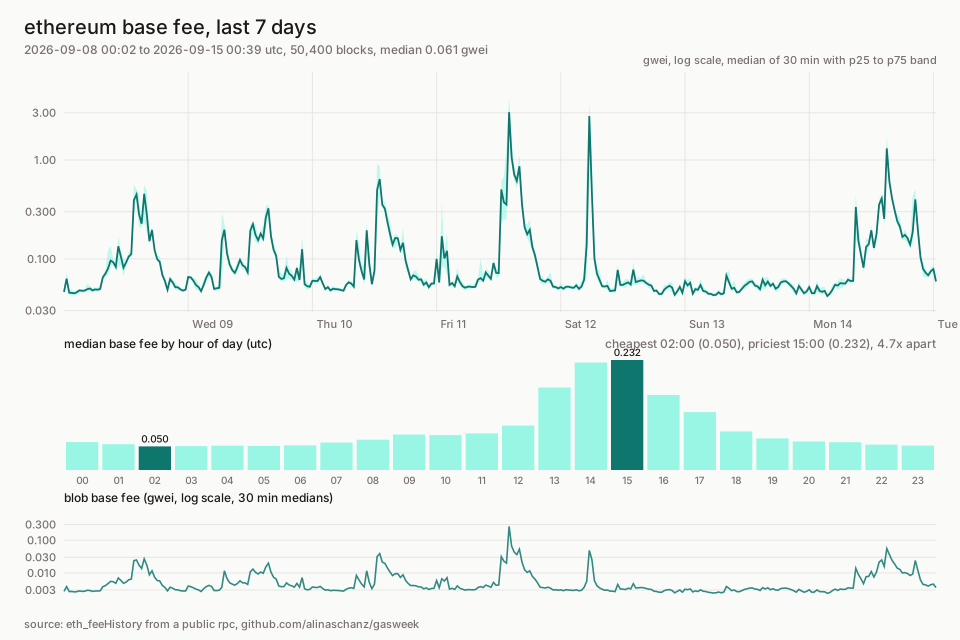
the chart above is rebuilt every night by the daily workflow, which also appends one row per day to data/daily.csv.
$ gasweek --tz +2
ethereum base fee, 50,400 blocks (25,878,924 to 25,929,323), 2026-09-01 00:44 to 2026-09-08 01:20 utc
overall  min 0.029  p25 0.050  median 0.072  p75 0.120  p90 0.202  max 2.11 gwei  |  blob median 0.004 gwei
blocks were 51% full on average

hour (utc+2)  median     p25     p75
00:00        0.050   0.045   0.058  ######
01:00        0.047   0.044   0.050  ######
02:00        0.048   0.045   0.053  ######
03:00        0.048   0.044   0.061  ######
04:00        0.052   0.045   0.099  ######
05:00        0.060   0.049   0.085  #######
06:00        0.064   0.049   0.092  ########
07:00        0.059   0.048   0.070  #######
08:00        0.052   0.047   0.061  ######
09:00        0.060   0.049   0.080  #######
10:00        0.068   0.058   0.090  ########
11:00        0.078   0.054   0.110  ##########
12:00        0.074   0.047   0.113  #########
13:00        0.085   0.049   0.108  ##########
14:00        0.110   0.084   0.147  #############
15:00        0.164   0.087   0.246  ####################
16:00        0.159   0.097   0.263  ###################
17:00        0.197   0.095   0.309  ########################
18:00        0.171   0.121   0.290  #####################
19:00        0.122   0.090   0.180  ###############
20:00        0.108   0.079   0.153  #############
21:00        0.090   0.073   0.137  ###########
22:00        0.071   0.057   0.103  #########
23:00        0.052   0.046   0.063  ######

cheapest hour  01:00-02:00 utc+2  median 0.047 gwei
priciest hour  17:00-18:00 utc+2  median 0.197 gwei  (4.2x)

weekday  median
mon        0.063  ##############
tue        0.092  ####################
wed        0.107  ########################
thu        0.091  ####################
fri        0.092  #####################
sat        0.057  #############
sun        0.055  ############
that week the answer was: berlin night, or the weekend. the us afternoon costs four times the berlin night, and even then the whole range sits under a quarter of a gwei.
install
pipx install git+https://github.com/alinaschanz/gasweek
or clone it and run python -m gasweek from the folder. python 3.10 or newer, no dependencies.
use
gasweek                              # last 168 hours, hours in utc
gasweek --tz +2                      # hour-of-day table in berlin summer time (+1 in winter)
gasweek --hours 24                   # just yesterday
gasweek --svg fees.svg               # the chart
gasweek --csv blocks.csv             # every block: number, timestamp, base fee, gas used ratio, blob fee
gasweek --json                       # the summary as json
gasweek --summary-append daily.csv   # one row per run, header written once
gasweek --tips                       # plus the priority fees people actually paid, p10/p50/p90 per block
gasweek --rpc https://your.node      # your own endpoint first
--tips asks eth_feeHistory for reward percentiles; the table gets a tip p50 column per hour and
the csv three tip columns, which answers "what do i set as priority fee at this hour" without a second
tool. the answers are bigger, so a full week takes about twice as long.
a full week is 50,400 blocks, fetched as 50 pages of 1024 in parallel; it takes a minute or two on a public node.
how it works
eth_feeHistoryreturns the base fee per block (the eip-1559 one), the gas used ratio and, since cancun, the blob base fee. it does not return timestamps.- so one block header per page is fetched and the blocks in between are interpolated;
post-merge blocks are 12 s apart except for missed slots, which keeps the error inside a
page under a minute.
fees.pyhas the arithmetic. - percentiles are plain order statistics with linear interpolation; hour and weekday bins
follow
--tz. the chart is a string of svg elements: a log-scale line of 30 minute medians with a p25-p75 band, and the hour-of-day medians as bars. - endpoints: publicnode, drpc, mevblocker, tenderly, blastapi, in that order.
the dataset
data/daily.csv gets a row per day at 00:17 utc: min, p25, median, p75, p90 and max base
fee of the previous 24 hours, cheapest and priciest hour, average block fullness, median
blob fee. columns are described in data/README.md. it starts on
2026-09-08; if you want the same numbers for an older window, gasweek --hours N --summary-append reproduces a row from any node that still serves the history.
every monday morning a workflow posts the week as a
discussion: the seven daily rows and the
hour-of-day table from a fresh run. .github/scripts/weekly_report.py is the whole of it.
see also
- onchain-notes:
gas_now.py, the same fee market as a cost per action, right now - bigmoves, stablepeg, ens-lookup
- the notes: alinaschanz.life, the short version on x
verify a release
from the next release on, every release carries the sdist and the wheel, a SHA256SUMS file, an
opentimestamps proof of that file, and a build provenance attestation made in github's own signing
flow. with the files downloaded into one folder:
sha256sum -c SHA256SUMS
gh attestation verify ./*.whl --owner alinaschanz
ots verify SHA256SUMS.ots
the attestation names the commit and the workflow run that produced the file; the timestamp proves the checksums existed before a certain bitcoin block; the commit itself is signed.
license
files
| path | lines | bytes |
|---|---|---|
.editorconfig# | 15 | 233 |
.github/dependabot.yml# | 8 | 237 |
.github/scripts/weekly_report.py# | 97 | 4,201 |
.github/workflows/ci.yml# | 32 | 708 |
.github/workflows/daily.yml# | 32 | 1,001 |
.github/workflows/pypi.yml# | 30 | 1,097 |
.github/workflows/release.yml# | 43 | 1,515 |
.github/workflows/scorecard.yml# | 33 | 889 |
.github/workflows/weekly.yml# | 30 | 906 |
.gitignore# | 7 | 66 |
.pre-commit-config.yaml# | 13 | 321 |
CHANGELOG.md# | 22 | 958 |
CONTRIBUTING.md# | 28 | 1,314 |
LICENSE# | 21 | 1,069 |
README.md# | shown above | |
data/README.md# | 11 | 644 |
data/daily.csv# | 9 | 1,153 |
data/last-7d.svg# | 97 | 23,726 |
gasweek/__init__.py# | 2 | 127 |
gasweek/__main__.py# | 5 | 52 |
gasweek/cli.py# | 161 | 8,148 |
gasweek/fees.py# | 106 | 4,343 |
gasweek/rpc.py# | 64 | 2,635 |
gasweek/stats.py# | 111 | 3,960 |
gasweek/svg.py# | 129 | 7,222 |
pyproject.toml# | 43 | 1,175 |
tests/test_cli.py# | 61 | 3,070 |
tests/test_live.py# | 18 | 562 |
tests/test_stats.py# | 140 | 5,975 |
tests/test_weekly_report.py# | 60 | 2,667 |

history
the latest 10 commits. all 23, with the signature of each: the commit list.
open questions
gaps i know about, from my own list. if you have an answer, write to hello@alinaschanz.life.
a rerun of the daily workflow added a second row for the same date
ran the workflow by hand after a failed night and got two rows for 2026-09-08 in data/daily.csv. --summary-append should replace the row for the same utc date, not add a twin; the data contract says one row per date.