Worked with · 02 of 12Layer 2arbitrum.io
Arbitrum
I collaborated with the Arbitrum team on research around incentive design, liquidity and the market structure developing across the ecosystem.
What incentives buy
A central part of the work was understanding what ARB incentives were actually buying. Programs such as STIP created visible increases in TVL, trading volume and user activity, but those numbers did not necessarily tell us whether the underlying activity would remain once rewards stopped.
Fig. 1What a headline number hides
Schematic, not data
Liquidity
I spent time looking at liquidity before, during and after incentive periods. The question was not simply whether TVL increased. I wanted to understand where capital came from, how sensitive it was to changes in yield, how quickly liquidity providers moved when rewards changed, and which protocols were able to retain activity without continuing to subsidize it.
Fig. 2Four questions about liquidity
- 01Where the capital came from
- 02How sensitive it was to yield
- 03How quickly providers moved
- 04Who kept activity without a subsidy
Incentive structures
We also looked at different incentive structures. Direct liquidity emissions, trading fee rebates, usage rewards and more gamified programs can produce very different user behavior. That made it useful to compare the amount of ARB distributed with the activity it generated, and then check how much of that activity survived after the program ended.
Fig. 3Three numbers per program
- 01ARB distributedWhat the program paid
- 02Activity generatedWhile it ran
- 03Activity that survivedAfter it ended
Retention
Retention was one of the more interesting parts of the work. A protocol can show strong growth during an incentive campaign while attracting users who are mainly optimizing for rewards. I looked at the difference between that kind of mercenary activity and users or liquidity that became meaningfully embedded in the Arbitrum ecosystem.
Fig. 4Mercenary and embedded
Schematic, not data
Beyond headline TVL
That meant going beyond headline TVL. I worked with metrics such as trading volume, active users, transactions, liquidity retention and fees, comparing them across different periods and protocol categories. Where possible, I also looked at the wider effect on Arbitrum rather than treating every protocol in isolation.
Fig. 5Compared across periods and protocol categories
- Trading volume
- Active users
- Transactions
- Liquidity retention
- Fees
Back to the network
Another part of the work was understanding how protocol activity translates back into the economics of the network. More transactions and trading activity also affect sequencer usage and fee generation, so incentive efficiency can be looked at from both sides: what a protocol gains from the subsidy and what that activity contributes back to Arbitrum.
Fig. 6Both sides of incentive efficiency
- 01ARB incentivesPaid to a protocol
- 02Protocol activityTransactions and trading
- 03Sequencer usageAnd fee generation
- 04ArbitrumWhat the network gets back
Where incentives stop
What interested me most was the point where incentives stop being responsible for the activity. If a pool, market or protocol still has users, liquidity and integrations after the subsidy ends, there is something more durable underneath it. If the activity disappears with the rewards, the initial growth number tells a very different story.
What I took from it
The collaboration gave me a much better framework for looking at ecosystem growth. I stopped treating TVL or transaction counts as outcomes on their own and started asking what produced them, how expensive that growth was, and what remained after the incentive changed.
Materials
Public pages about the company and the programs around this work.
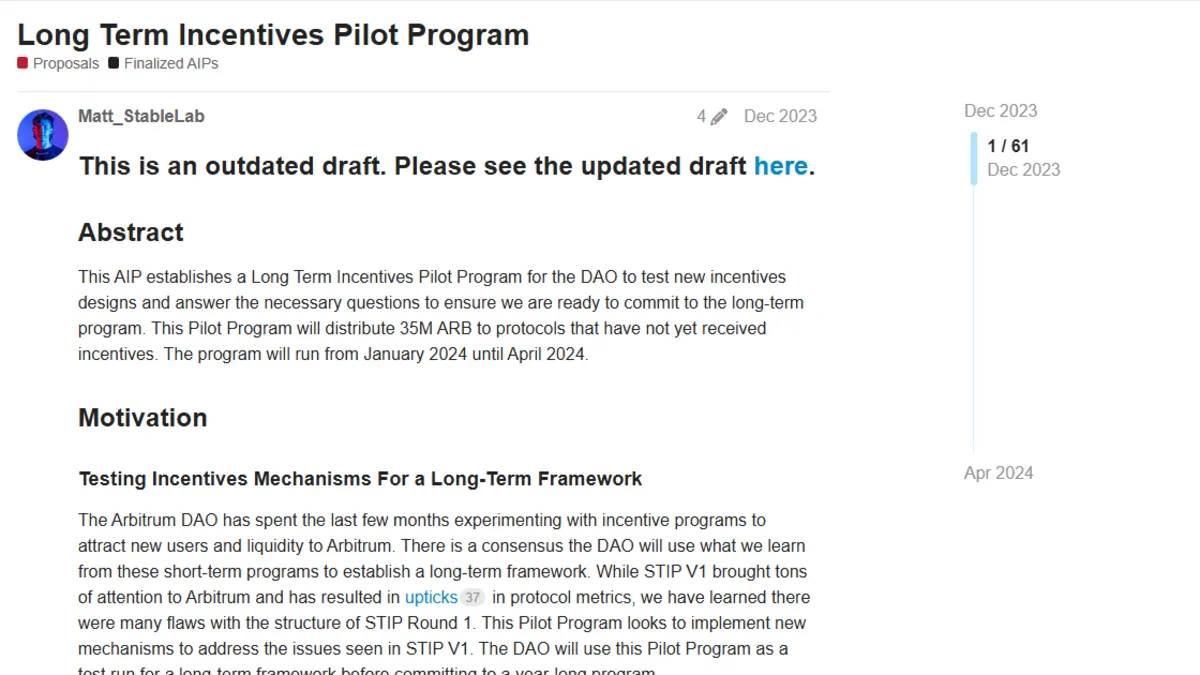 Screenshot, Oct 5, 2026
Arbitrum DAO forum · December 2023
Long Term Incentives Pilot Program
The DAO proposal for a pilot to test new incentive designs before committing to a long-term program. The first post is an early draft; the updated one is later in the same thread.
Screenshot, Oct 5, 2026
Arbitrum DAO forum · December 2023
Long Term Incentives Pilot Program
The DAO proposal for a pilot to test new incentive designs before committing to a long-term program. The first post is an early draft; the updated one is later in the same thread.